Are you a Null Hypothesis or an Alternate Hypothesis? What does this question means?
Null V/S Alternative Hypothesis
| Parameter | Null Hypothesis | Alternative Hypothesis |
|---|---|---|
| Definition | A null hypothesis is a statement in which there is no relation between the two variables. | An alternative hypothesis is a statement in which there is some statistical relationship between the two variables. |
| What is it? | Generally, researchers try to reject or disprove it. | Researchers try to accept or prove it. |
| Testing Process | Indirect and Implicit | Direct and Explicit |
| p-value | Null hypothesis is rejected if the p-value is less than the alpha-value; otherwise, it is accepted. | An alternative hypothesis is accepted if the p-value is less than the alpha-value otherwise, it is rejected. |
| Notation | #!math H_0 | #!math H_1 |
| Symbol | Used Equality Symbol (=, ≥, ≤) | Inequality Symbol (≠, <, >) |
- Null hypothesis assumes no effect or relationship, while the alternative hypothesis suggests the presence of an effect or relationship.
- Researchers try to reject or disprove the null hypothesis, whereas they aim to accept or prove the alternative hypothesis.
- Null hypothesis testing is indirect and implicit, while alternative hypothesis testing is direct and explicit.
- Null hypothesis is represented by H0 with an equal sign, while the alternative hypothesis is denoted by H1 with an unequal sign.
:art: Illustrate Hypothesis Testing
Scenario
A researcher believes that a new teaching method improves student performance in mathematics compared to the traditional method. The average score of students using the new method is expected to be higher than the average score of students using the traditional method.
Hypotheses
Null Hypothesis #!math (H_0): The average score of students using the new teaching method is the same as or lower
than the average score of students using the traditional method
#!math (H_0:\mu_{\text{new}} \le \mu_{\text{traditional}}).
Alternative Hypothesis #!math (H_a): The average score of students using the new teaching method is higher than
the average score of students using the traditional method #!math (H_a:\mu_{\text{new}} \gt \mu_{\text{traditional}}).
Steps
- Formulate Hypotheses: Establish the null and alternative hypotheses.
- Collect Data: Administer both teaching methods to two groups of students and collect their test scores.
- Calculate Test Statistic: Compute the test statistic, such as the t-test, based on the sample data.
- Compare to Critical Region: Compare the test statistic to critical values to determine if it falls in the critical region.
- Calculate p-value: Calculate the p-value associated with the test statistic.
- Make Conclusion: Based on the p-value and significance level, either reject the null hypothesis if the p-value is less than the significance level or fail to reject it.
In this example, ^^if the p-value is less than the chosen significance level (e.g., 0.05), you would reject the null hypothesis and conclude that there is evidence to support the claim that the new teaching method leads to higher student performance in mathematics^^. This demonstrates how hypothesis testing allows researchers to draw conclusions based on statistical evidence and make informed decisions.
Hypothesis Example (Using ChatGPT)
Does a New Drug Reduce Blood Pressure?
In this example, we’ll demonstrate hypothesis testing using a hypothetical scenario where a pharmaceutical company has developed a new drug intended to reduce blood pressure in patients with hypertension. We’ll design and conduct a hypothesis test to determine whether the new drug is effective in reducing blood pressure compared to a placebo.
-
Hypotheses Formulation
- Null Hypothesis (H0): The new drug has no effect on reducing blood pressure, and any observed differences are due to random chance.
- Alternative Hypothesis (Ha): The new drug effectively reduces blood pressure in patients, leading to a significant difference compared to the placebo.
-
Data Collection
- We collect blood pressure measurements from two groups of participants: one receiving the new drug (treatment group) and the other receiving a placebo (control group).
- Each participant’s blood pressure is measured before and after the treatment period.
-
Experimental Design
- Randomly assign participants to either the treatment group (receiving the new drug) or the control group (receiving a placebo).
- Ensure blinding to minimize bias, where neither the participants nor the researchers know who is receiving the drug or the placebo.
-
Data Analysis
- Calculate the mean blood pressure reduction for each group.
- Conduct a hypothesis test, such as a two-sample t-test, to compare the mean blood pressure reductions between the treatment and control groups.
-
Interpretation of Results
- If the p-value is less than the chosen significance level (e.g., α = 0.05), we reject the null hypothesis in favor of the alternative hypothesis.
- A statistically significant result indicates that the new drug has a significant effect on reducing blood pressure compared to the placebo.
- Conversely, if the p-value is greater than the significance level, we fail to reject the null hypothesis, suggesting no significant difference between the groups.
-
Conclusion and Recommendations
- If the hypothesis test results support the alternative hypothesis, we conclude that the new drug is effective in reducing blood pressure.
- The pharmaceutical company can proceed with further clinical trials and regulatory approvals for the new drug.
- If the results do not support the alternative hypothesis, the company may need to reevaluate the drug’s efficacy or explore alternative treatment options.
import numpy as np
from scipy.stats import ttest_ind
# Simulated blood pressure data
treatment_group = np.array([140, 135, 150, 138, 132]) # Blood pressure reduction after new drug
control_group = np.array([145, 142, 148, 146, 140]) # Blood pressure reduction after placebo
# Perform two-sample t-test
t_statistic, p_value = ttest_ind(treatment_group, control_group)
# Interpretation of results
alpha = 0.05
if p_value < alpha:
print("The new drug significantly reduces blood pressure compared to the placebo.")
else:
print("There is no significant difference in blood pressure reduction between the groups.")
# Additional analyses, visualization, and interpretation can be conducted as needed.- We simulate blood pressure reduction data for participants in the treatment and control groups.
- We use a two-sample t-test to compare the mean blood pressure reductions between the two groups.
- If the p-value is less than the significance level (e.g., 0.05), we conclude that the new drug is effective in reducing blood pressure.
- Otherwise, we fail to reject the null hypothesis, indicating no significant difference between the groups.
Errors
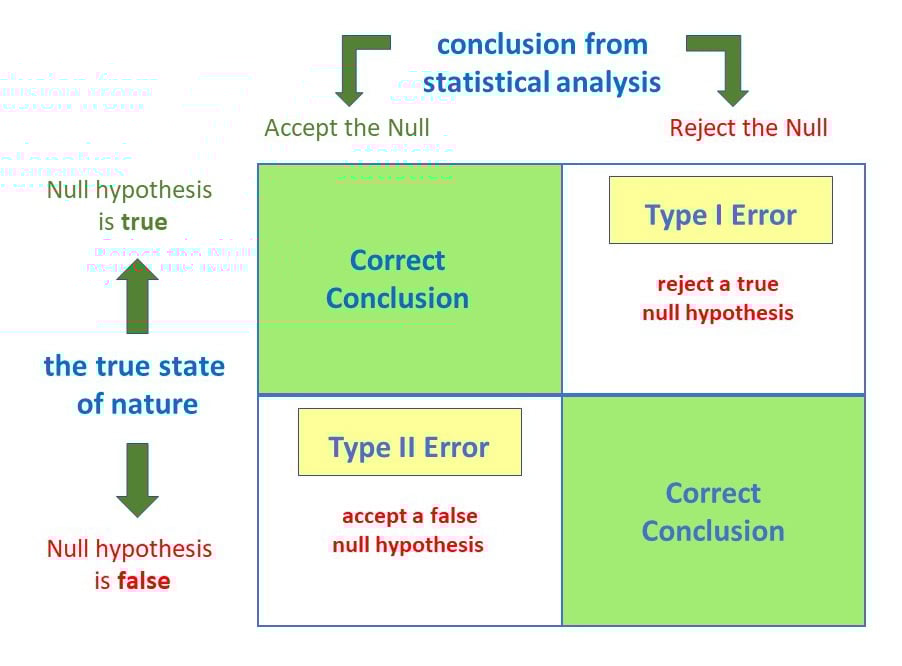
In hypothesis testing, there are two types of errors that can occur when making a decision about the null hypothesis: Type I error and Type II error.
Type 1 Error
Type-I (False Positive) error occurs when the sample results, lead to the rejection of the null hypothesis when it is in fact true.
In other words, it’s the mistake of finding a significant effect or relationship when there is none. The probability of committing a Type I error is denoted by α (alpha), which is also known as the significance level. By choosing a significance level, researchers can control the risk of making a Type I error.
Type 2 Error
Type-II (False Negative) error occurs when based on the sample results, the null hypothesis is not rejected when it is in fact false.
This means that the researcher fails to detect a significant effect or relationship when one actually exists. The probability of committing a Type II error is denoted by β (beta). Trade-off between Type 1 and Type 2 errors
Where Can Be Hypothesis Testing Applied?
- Testing the effectiveness of interventions or treatments: Hypothesis testing can be used to determine whether a new drug, therapy, or educational intervention has a significant effect compared to a control group or an existing treatment.
- Comparing means or proportions: Hypothesis testing can be used to compare means or proportions between two or more groups to determine if there’s a significant difference. This can be applied to compare average customer satisfaction scores, conversion rates, or employee performance across different groups.
- Analysing relationships between variables: Hypothesis testing can be used to evaluate the association between variables, such as the correlation between age and income or the relationship between advertising spend and sales.
- Evaluating the goodness of fit: Hypothesis testing can help assess if a particular theoretical distribution (e.g., normal, binomial, or Poisson) is a good fit for the observed data.
- Testing the independence of categorical variables: Hypothesis testing can be used to determine if two categorical variables are independent or if there’s a significant association between them. For example, it can be used to test if there’s a relationship between the type of product and the likelihood of it being returned by a customer.
- A/B testing: In marketing, product development, and website design, hypothesis testing is often used to compare the performance of two different versions (A and B) to determine which one is more effective in terms of conversion rates, user engagement, or other metrics.
Hypothesis Testing in ML Applications
- Feature selection: Hypothesis testing can help identify which features are significantly related to the target variable or contribute meaningfully to the model’s performance. For example, you can use a t-test, chi-square test, or ANOVA to test the relationship between individual features and the target variable. Features with significant relationships can be selected for building the model, while non-significant features may be excluded.
- Hyperparameter tuning: Hypothesis testing can be used to evaluate the performance of a model trained with different hyperparameter settings. By comparing the performance of models with different hyperparameters, you can determine if one set of hyperparameters leads to significantly better performance.
- Assessing model assumptions: In some cases, machine learning models rely on certain statistical assumptions, such as linearity or normality of residuals in linear regression. Hypothesis testing can help assess whether these assumptions are met, allowing you to determine if the model is appropriate for the data.
- Model comparison: Hypothesis testing can be used to compare the performance of different machine learning models or algorithms on a given dataset. For example, you can use a paired t-test to compare the accuracy or error rate of two models on multiple cross- validation folds to determine if one model performs significantly better than the other.
Questions
- What is P-value?
- What are different types of Hypothesis Tests.
- Differences between Z-test and T-test?